 What the heck are Bollinger Bands?
Bollinger Bands were developed by John Bollinger. They are envelopes (or could be thought of as sandwiches with the moving average of price as the filling) plotted at a standard deviation (which can be adjusted) above and below a simple moving average of the price. As the distance apart of the bands is based on standard deviation, the bands naturally adjust to swings in the underlying price being measured.
The width of the bands and underlying trend can be indicative of pending shifts in price. For example when the bands are narrow and remain narrow for a period of time which is indicative of a period of low volatility it can portend a more significant future price movement up or down which in turn would require other technical indicators to evaluate alongside it. The timeframe over which Bollinger Bands are observed or utilized is likewise an important factor to take into account and can also weaken or strengthen their validity or usefulness. If you are observing these over hourly, daily, weekly or monthly time frames they will yield different value.
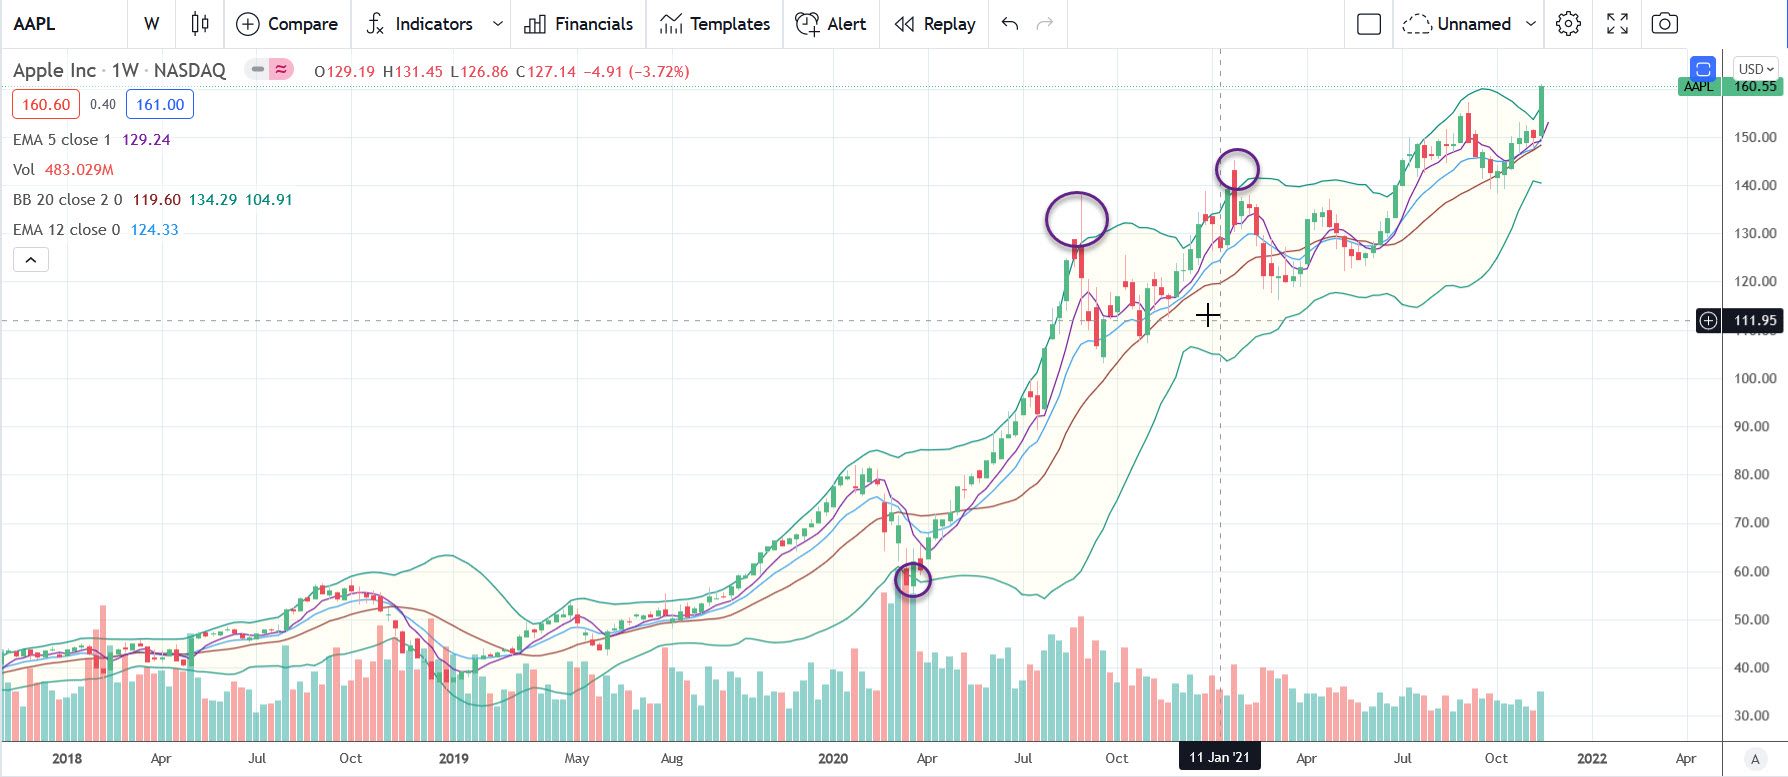
As a volatility indicator there is merit - alongside evaluating the overall trend in price - to observing the "extreme" points where price lives outside the outer ends of the bollinger bands whether to the upside or downside and evaluating whether these represent favorable entry or exit points. Again, the time horizon over which these are observed and utilized will be significant as to their use and usefulness. Reversion to the mean or "average" price is a reasonable constant but while this may be simple to observe, it does not happen along a predictable continuum but rather in a fluid stream that ebbs and flows according to price trends. In the diagram above of Apple stock which is being measured on a weekly timeframe you can observe how the instances of price falling outside of the bollinger bands represented potential entry and exit points depending on if your perspective was bullish or bearish on Apple.
Bollinger Bands are best used in conjunction with other technical analysis and fundamental evaluations of conditions for a market, stock or commodity and can be helpful to determine entry and exit points depending on the investment timeframe of an investor or fund manager.
It is always good to remember that there are no certainties in life other than death and taxes. There are probabilities, risks, innovation, trends, networks and patterns and these are important to understand, incorporate and manage when it comes to investments and money.
g