 This week, we are going to continue with our "key technical indicators" series for stocks or any publicly traded instrument for that matter. Today, we are going to explore "Bollinger Bands".
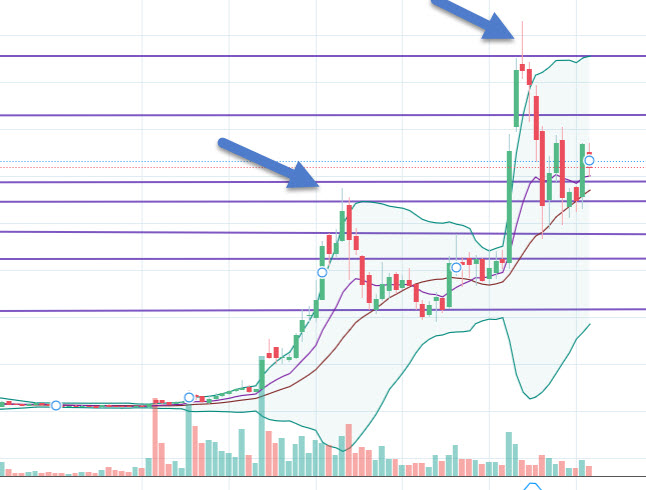
Bollinger bands are a volatility indicator that depict two deviations from a moving average in the price trend of a stock, commodity, fund etc. This is depicted as two lines on either side of a moving average indicator which represent the outer (upper and lower) bands from the moving average. When a stock, on the upside, rises above the outermost upper band as in the chart on the left this can indicate the stock is over bought and may be an opportune moment to sell. Likewise, if the price trend falls below the outermost lower band, it can indicate the stock is over-sold and may be an opportune moment to buy.
As with any technical indicator, these can be used over different trading timelines whether this is intra day, daily, weekly, monthly or any timeframe you may choose. Their relative significance will also vary by the timeline you choose and as always are useful to use in combination with other technical indicators and values.
When the outer bollinger bands are far apart the market movement or momentum either up or down is more pronounced, whereas when the bands are closer together market activity is more consistent following the moving average.Typically when the bands are closer together it will signal an imminent shift in direction, up or down. The outer bands also act as support or resistance areas after a price pattern has played out to a significant degree. In this respect, bollinger bands are useful indicators at key time or development intervals. In other words what you see on the chart to the left may seem quite obvious but when you are looking at the chart in real time, it can be harder to discern when exactly to buy or sell. As you can see the price movement can stay on or outside of the upper band for long periods of time.
Bollinger Bands are a tool that can be used in association with other indicators to analyze volatility and potential entry and exit points.
Technical analysis is a lifelong discipline requiring years of applied experience in the field. There are always exceptions to the rules for every technical pattern. Being able to discern the validity of a pattern and when to trade and to do so successfully more often than not, requires significant experience in association with many other indicators and professional money management disciplines.