Market Data Bank
Click image to enlarge
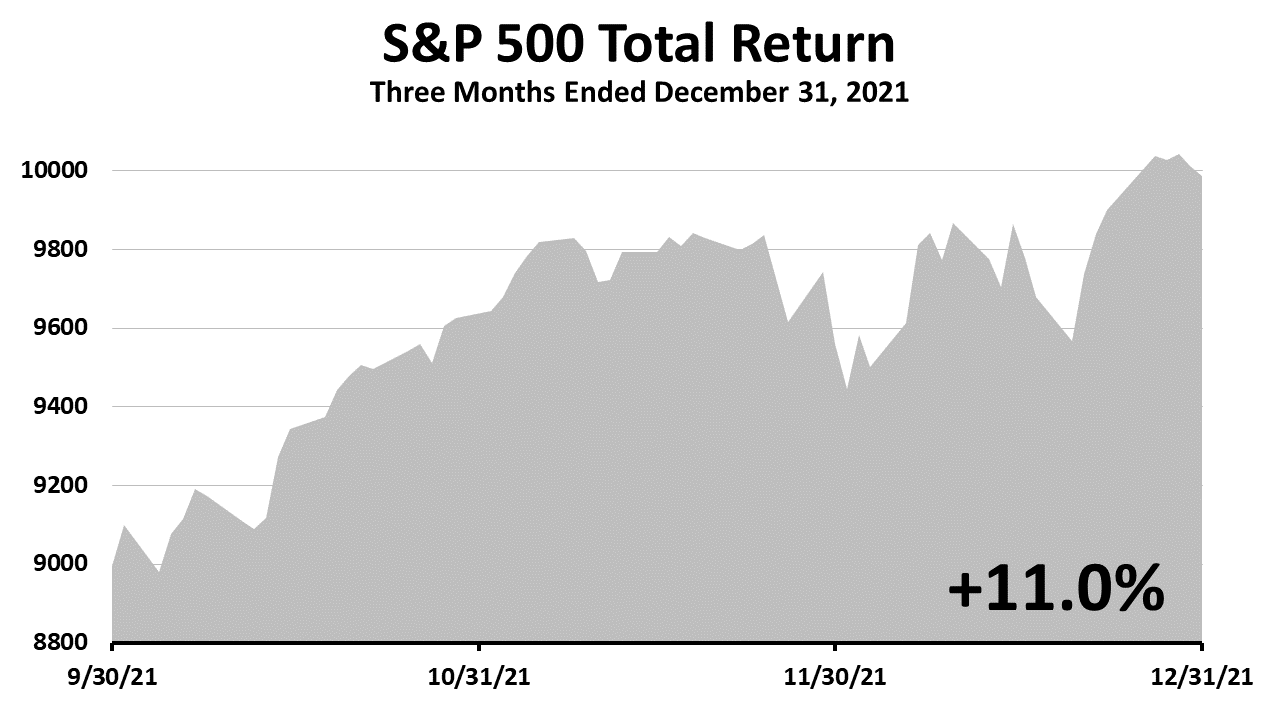
S&P 500 SOARED AGAIN
In the final quarter, the S&P 500 gained 11%. It was the seventh consecutive quarter of gains since the -19.6% quarterly loss in 1Q2020, when the pandemic struck. Between the March 23, 2020 bear market low and end of 4Q2021, the S&P 500 total return, which includes dividends reinvested, was more than 70%.
Click image to enlarge
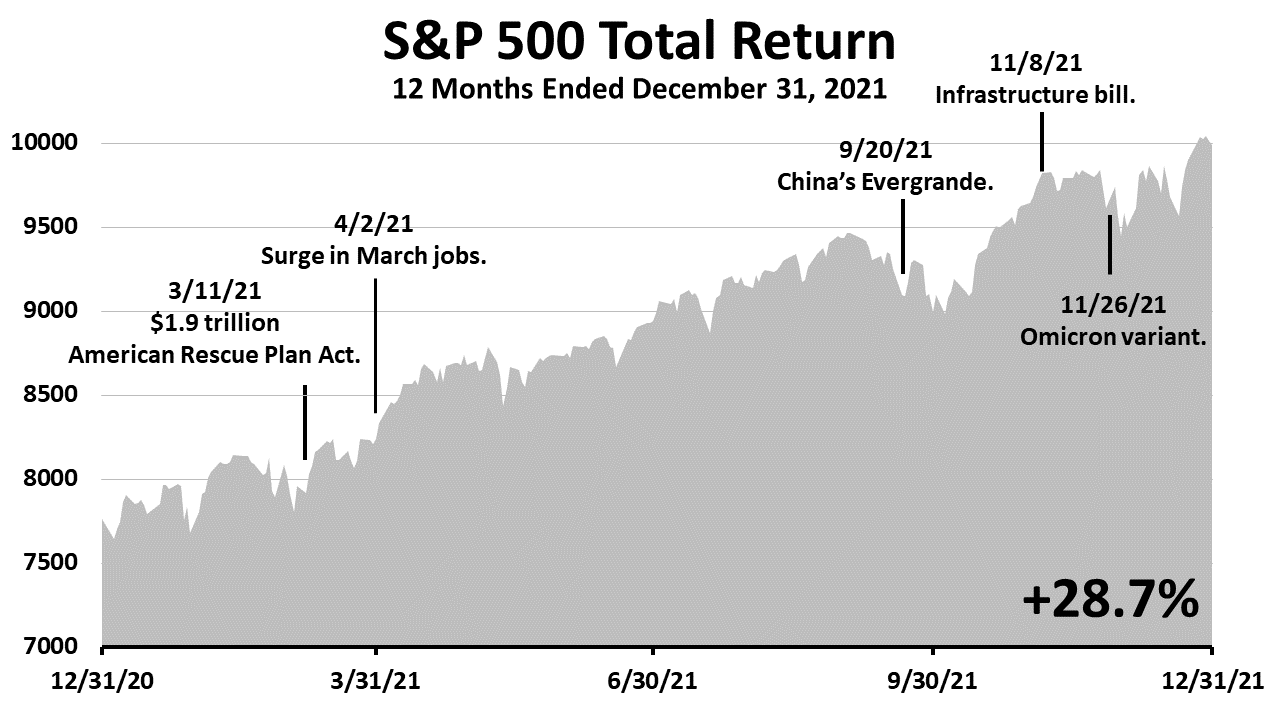
A 12-MONTH WALL OF WORRY
The S&P 500 gained 28.7%% in 2021. The hot economy, fueled by government pandemic aid and the lowest interest rates in U.S. history, drove stocks. With yields on U.S. Treasury bonds negative after inflation, stocks were more attractive than bonds and a new stock valuation paradigm was in place.
Click image to enlarge
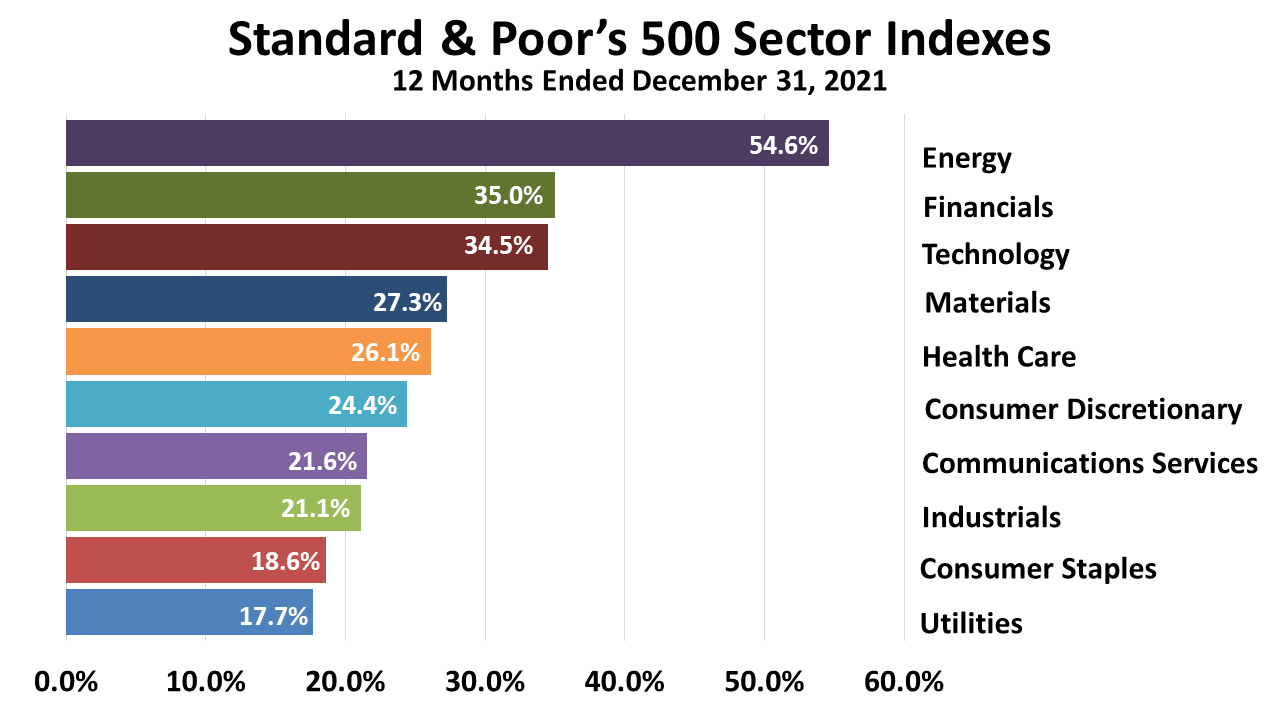
INDUSTRY SECTORS
All 10 industry sector indexes maintained by Standard & Poor’s showed positive returns in 2021. A rebound in oil prices fueled a +54.6% return on the S&P energy stock index in 2021. However, look at how poorly oil indexes performed relative to other investments over five years in the next chart.
Click image to enlarge
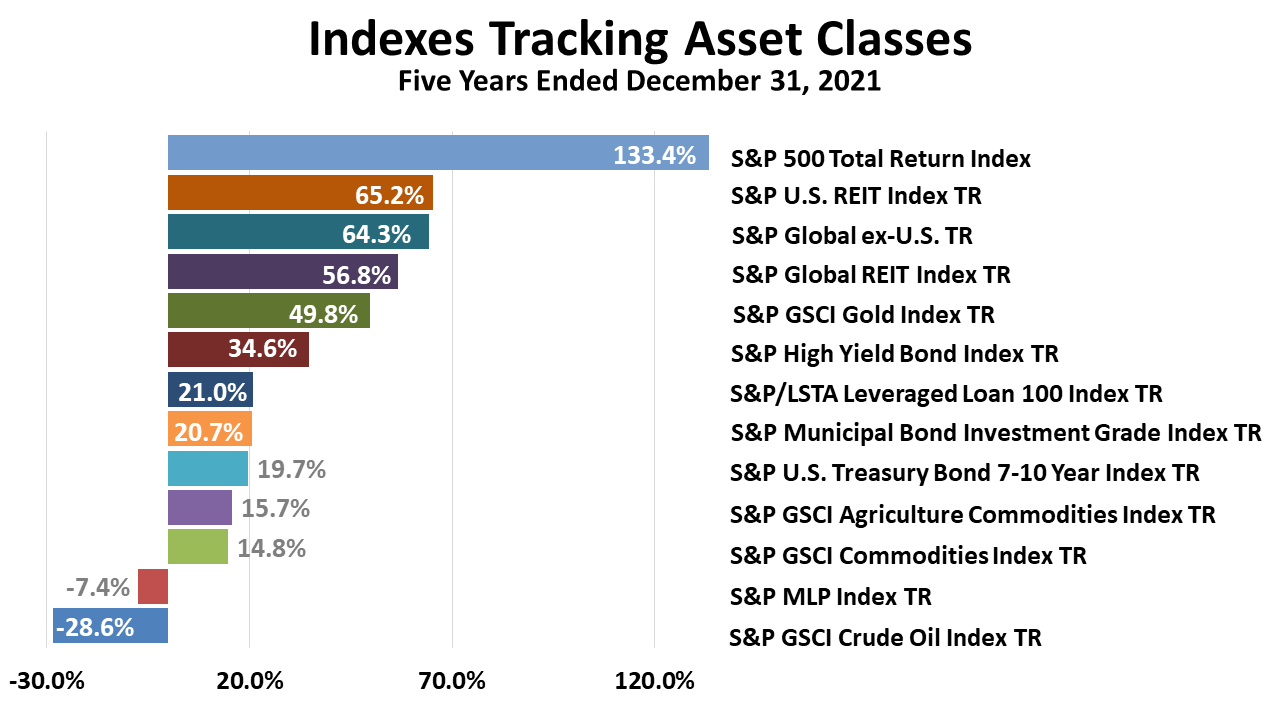
INDEXES TRACKING 13 ASSET CLASSES
Of 13 asset classes represented by indexes here, oil was the biggest loser over five years. Despite a rebound in 2021, oil investments lost -28.6%. Master limited partnerships, heavily weighted in the energy sector, was second-worst. But the main takeaway is the outstanding performance of the broad stock market.

Click image to enlarge
STRONG GROWTH EXPECTED IN 2022
In a big surprise, 4Q2021 growth was 6.9%! It propelled a growth rate for all 2021 of 5.7% -- the best growth since 1984! With economists underestimating the strength of the U.S. economy in 4Q2021, it’s likely the consensus forecast for 1Q2022 is also low, making a growth surprise in early 2022 more likely.
Click image to enlarge
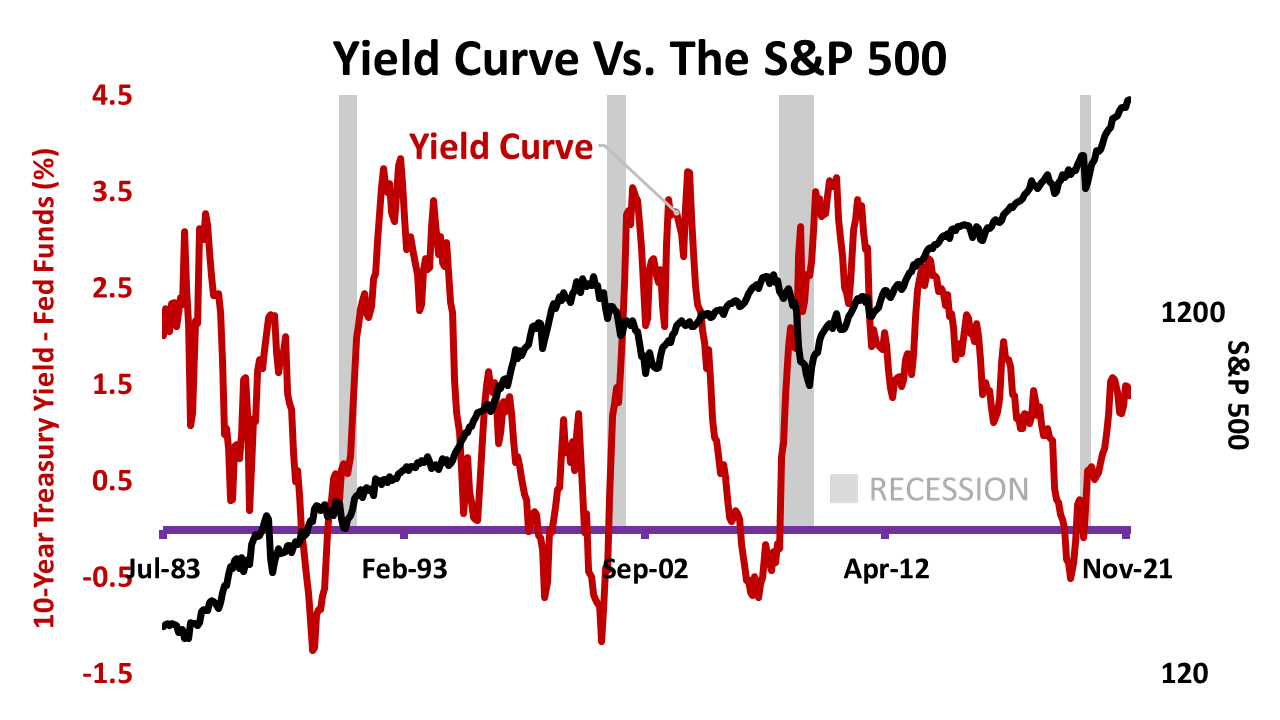
YIELD CURVE
The Federal Reserve Bank has caused every recession in the U.S. since 1950s by inverting the yield curve, making long-term yields fall below short-term yields. At 1.39%, the yield curve is not even close to inverting, and this Fed has been very accommodative for years. A positive yield curve is favorable for continued growth.
Past performance is never a guarantee of your future results. Indices and ETFs representing asset classes are unmanaged and not recommendations. Foreign investing involves currency and political risk and political instability. Bonds offer a fixed rate of return while stocks fluctuate. Investing in emerging markets involves greater risk than investing in more liquid markets with a longer history.