


 We have discussed Oscillators as indicators that will depict oversold and overbought conditions over different time periods. Oscillators will vary in what they depict depending on the inputs. In general they will map the trend of a given stocks price movement but depending on the inputs you can amplify the trend or conversely you can soften the overall trend. For short term investors amplifying the trend may provide more accurate short term signals for either entry or exit points and likewise for long term investors reducing the sensitivity of the signal will more accurately depict the long term momentum in price cycles and growth. Longer term investment horizons allow for more underlying data and therefore technical analysis will provide more reliable information for interpretation and analysis than short term investment horizons.
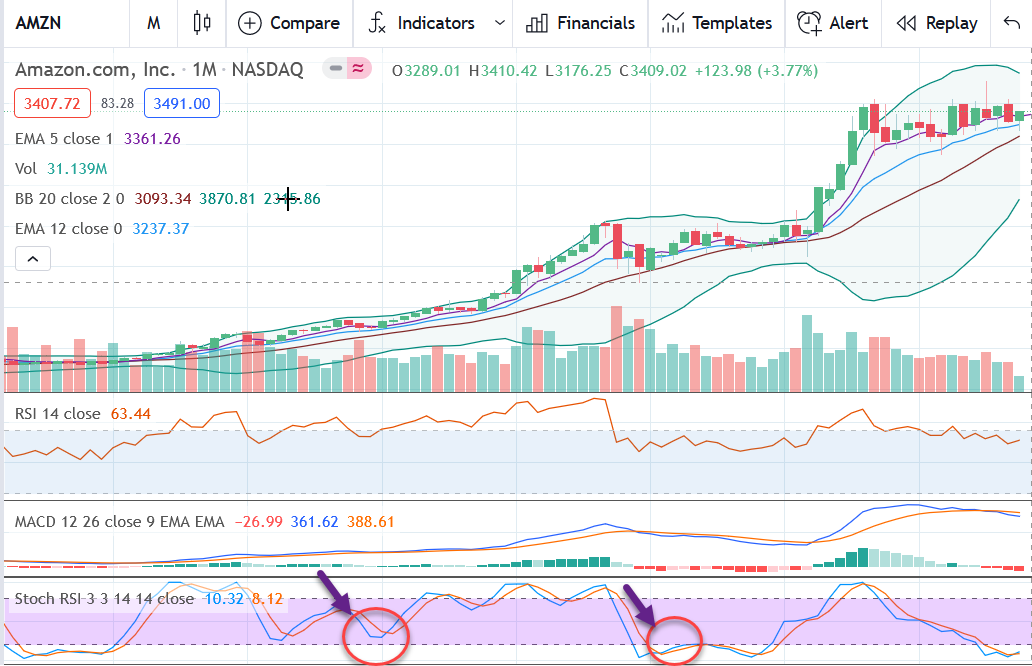
If investors believe in the long term growth prospects of a stock or fund (basket of companies) then buying at those times when price oscillates to the lower bands of the stochastic oscillators numeric ledger, usually 0-20 (which signals oversold conditions) can be on approach to steadily acumulate a position over time. Investors looking to rebalance their portfolios on a stock or fund that has outperformed the market for years may look at a long term oscillator top range, usually above 80 (which signals overbought conditions) as one of many different signals to assess when to exit a portion of their position and re-balance their portfolio. The chart on the right shows Amazon's monthly stock price movements and points to 2 moments in time when the stochastic oscillator was at a low. If you believed in the long term growth prospects of Amazon, both these moments in time would have provided good entry points to accumulate stock.
Technical analysis used in conjunction with macro analysis can provide a more balanced and objective perspective for purposes of portfolio management, entry and exits, investment and rebalancing decisions whether that is for an individual investor or asset manager over different time periods. Technical analysis is a tool which requires context and experience to assess and use. That context is based on the investment goals of an investor or fund manager.
 We have talked about the blockchain in prior articles. Many people associate the "blockchain" with "Bitcoin" but the blockchain is far more than Bitcoin. Bitcoin is a counter financial cyclical innovation that arose directly after and as a result of the 2007/8 financial crash and depression. We refer to it here as counter-cyclical because it has a deflationary monetary supply built into the code. It is not subject to human, governmental or political motivations that can inflate the money supply to unprecedented levels of indebtedness - in a monetary experiment - that devalues the worth of the currency, causes inevitable inflation and arguably impacts those who are the least well off, the most, over the mid to long term. Bitcoin's supply is fixed and known. It is finite. It is often referred to as a "store of value" - the equivalent of digital gold, except more easily stored on a comparative basis, more liquid and transportable, not to mention an increasingly globally accepted currency and asset class in the westernized world.
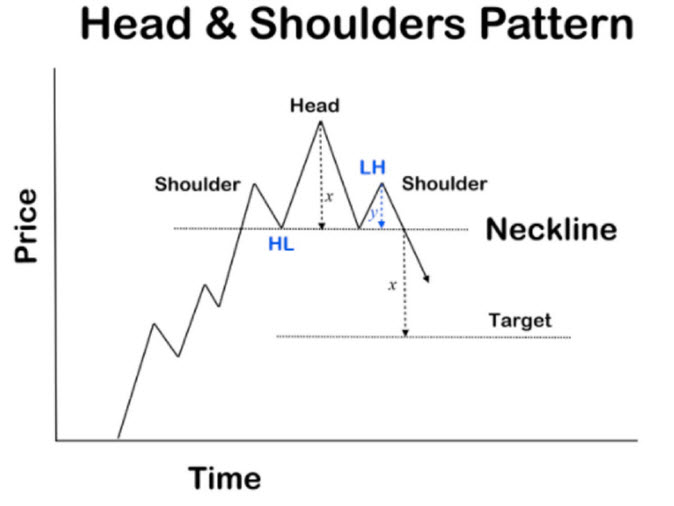 In this installment of our technical patterns education series, we will explore what is known as a "Head and Shoulders" pattern. This pattern can signal a shift in trend whether at the top of a price discovery trend or at the bottom (when it is referred to as an "inverse head and shoulders bottom" pattern).
 Institutional adoption of digital currencies and payment methods is on the rise. We are seeing a tectonic shift in the payments landscape along with the rise of Bitcoin. However, behind Bitcoin, blockchain companies and projects are looking to reinvent the way individuals and entire industries transact across the entire global industrial landscape.